Survey of Math Chapter 7: Data For Decisions
Example Chapter 7 #22 from text
A college allows students to choose either classroom or self paced instruction in a basic math course. The college wants to compare the effectiveness of the two modes of instruction. Someone proposes giving the same final exam to all the students in both versions of the course and comparing the average score of those who took classroom version versus the self paces version.
What does this proposal not take into account, which would yield its results worthless?
Given 30 students who are willing to use either self paced or classroom instruction, outline a better experimental design to compare the two methods of instruction.
Solution
Simply comparing the final grades is completely worthless as an experiment, since confounding of variables will most likely occur. The students will have chosen the instruction method they prefer, and this may mean the students samples in the two form of instruction will have very different properties. For example,
- Many older students may have more commitments on their time outside of school, and so choose the self paced instruction, so they can work when it is convenient for them.
- Many younger students may not feel comfortable being in charge of their own education, and desire more structure than the self paced class offers, so they choose the classroom instruction.
- Some students may work many hours a week, and the self paced instruction would be more convenient for them.
Since the sample groups could have very different properties, it would be impossible to tell if any difference in the final exam score was due to the method of instruction or the other differences in the groups.
To construct two samples which have more similar properties, we can use random numbers. Thankfully, we have 30 students willing to take the course with either mode of instruction. This is probably a highly unlikely situation in practice, unless you had a large number of students to draw from. Even then, finding the students willing to take the course in either mode is a voluntary response sample, so we are already selecting a group which might have differences from the general population!
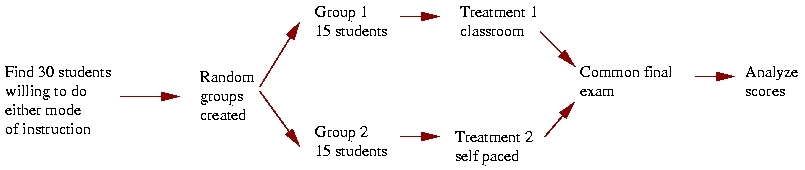
Here is a diagram of the randomized comparative experiment that is proposed:
To divide the 30 students into groups, we use a random number table.
| Row | Random Digits | |||
|---|---|---|---|---|
| 1 | 29717 | 89759 | 15323 | 02331 |
| 2 | 96091 | 70610 | 05465 | 97474 |
| 3 | 75114 | 47938 | 54766 | 76157 |
| 4 | 97291 | 31576 | 60391 | 93110 |
| 5 | 26540 | 07740 | 83084 | 30485 |
| 6 | 33946 | 19391 | 14439 | 88649 | 7 | 75357 | 07486 | 77770 | ... |
If we label the 30 students as 00 to 29, we get the following samples using the random numbers starting at column 1:
| Row | Random Digits | |||||||||
|---|---|---|---|---|---|---|---|---|---|---|
| 1 | 29 | 71 | 78 | 97 | 59 | 15 | 32 | 30 | 23 | 31 |
| 2 | 96 | 09 | 17 | 06 | 10 | 05 | 46 | 59 | 74 | 74 |
| 3 | 75 | 11 | 44 | 79 | 38 | 54 | 76 | 67 | 61 | 57 |
| 4 | 97 | 29 | 13 | 15 | 76 | 60 | 39 | 19 | 31 | 10 |
| 5 | 26 | 54 | 00 | 77 | 40 | 83 | 08 | 43 | 04 | 85 |
| 6 | 33 | 94 | 61 | 93 | 91 | 14 | 43 | 98 | 86 | 49 |
Group one will consist of the students we associated with labels 29, 15, 23, 09, 17, 06, 10, 05, 11, 13, 19, 00, 08, 04, 14. The remaining students will form Group 2.
This experiment will make the samples more similar to each other by using random numbers, and hopefully reduce the confounding of variables.