Survey of Math Chapter 5: Producing Data
Definitions
The data collected by sampling will vary with the sample collected. Repeated random samples vary in a regular way since random numbers are used to choose the sample.
It is desirable to take many samples from a population to estimate how trustworthy our results are.
The data collected in a sample can be represented in a histogram. A histogram is a graphical representation of data: the height of the bars in a histogram represent the number of times data was collected in the range at the base of the bar over a sample, or population, or even a number of different samples!
The margin of error says how close to the truth about the population the sample results would be in 95% of all samples drawn by the method used to draw one sample. In other words, it is a measure of how precisely the sample results reflect the beliefs of the entire population.
We say we have 95% confidence that the truth about the population lies within the margin of error.
Finding the margin of error exactly is difficult work. There is a quick method for estimating the margin of error, by calculating 100 divided by the square root of the sample size.
The margin of error only estimates the error of chance in using simple random sampling techniques. The margin of error calculation does not account for bias in a sampling technique (for example, a voluntary response sample or a convenience sample).
Histograms
A histogram is an effective way to represent data. It consists of bars (or rectangles) where the base of the rectangle represents a range of numbers, and the height of the rectangle is the number of times the measured quantity occurs within that range.
Consider the following example which represents tests scores. The bars in the histogram represent the number of students who scored within the range at the base of the rectangle.
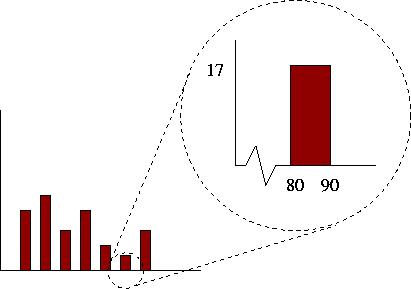
In the above example, we see that 17 students scored between 80 and 90 on the test. The total number of students who wrote the test could be determined by adding together the heights of all the bars.
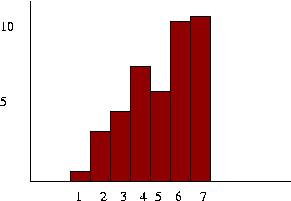
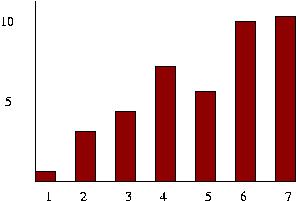
Histograms can either be drawn so the bars are touching, or the bars can be separated by some white space.
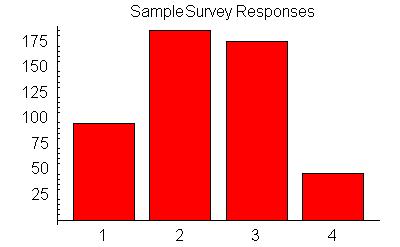
Here are two histograms that would result from a seven question poll. The base of the bars is not labeled by a range any more, but by a number representing the seven questions. The number of people in the sample could be determined by adding the heights of all the bars, assuming that each member of the sample could only choose one of the seven possible responses.
 |
 |
Example
The Gov of Minnesota wants to have some idea what the residents of Minnesota think about the issue of raising taxes to improve education facilities (infrastructure) in the state.
Before serious discussions begin, they want to take the pulse of the residents by conducting a simple poll.
To do this, they decide to conduct a
phone poll: they will phone, choosing phone numbers at random, 500 residents of
Minnesota and ask them to choose the answer that most represents
their position on the question "Should Minnesota raise state taxes to improve
the infrastructure of the schools in Minnesota". The choices offered are:
1) Yes, if my taxes do not go up by more than $100.
2) No, most definitely not.
3) Undecided/need more information.
4) If you are going to raise taxes, spend the money on something else.
Minnesota has a population of almost 5 million people (census). This is the population.
I ran my own computer simulation, constructing a population of 5 million with a response to the question from 1 to 4, and then sampling the population at 500 randomly chosen positions.
The way I have constructed my data, I have ignored diversity which might play an important
role in the real world application of this method.
Some of the things that might make my study not sample
diversity properly would be:
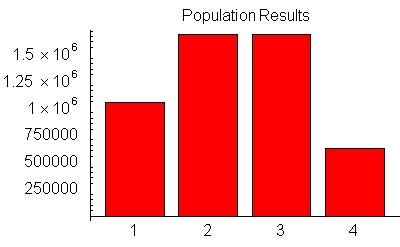
Since we are interested in seeing how accurate our sampling techniques are, here is the histogram for the entire population. This information is, of course, unknown to the person taking the poll.
|
|
Here are the results from my ''poll'' of 500 people chosen randomly from the population:
|
|
Notice that we actually get quite good results from using "only" 500 people. Well designed samples can produce good estimates for the behaviour of the population.
The margin of error can be estimated using the formula 100/Sqrt(500) ~ 4.47%. This means that our sample gives us results that comes within plus or minus 4.47% of the truth 95% of the time.
Obviously, a smaller sample size increases the margin of error. However, since there is a square root in the quick method for margin of error, to cut the margin of error in half we must increase the sample size by 4!